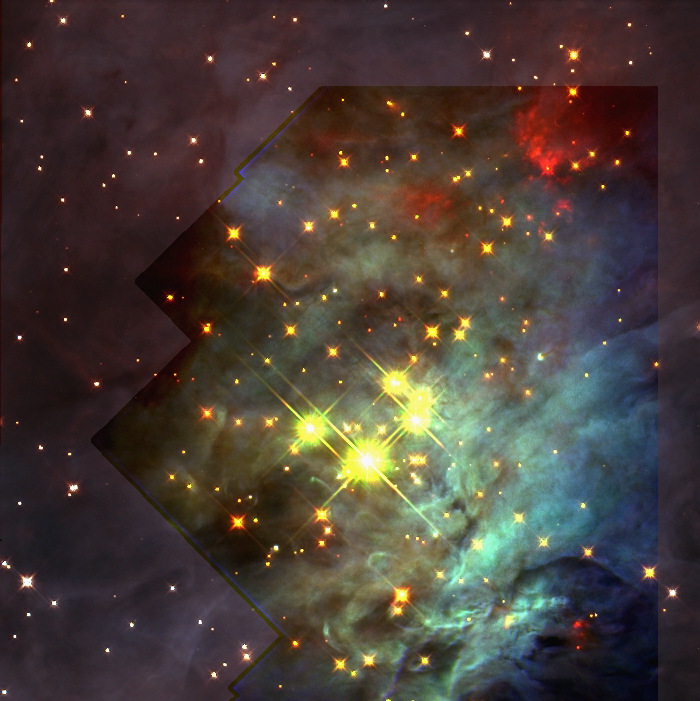
NICMOS + WFPC2
12/20/1999 - I have now made a composite NIR+visual image combining our F110W and F160W NICMOS data (discussed below) now publically available WFPC-2 line filter images from John Bally's program taken on 17March 1995 (see Bally et. al, AJ 116, 293). That image combines the NICMOS F160W(=red), F110W(=green) and WFPC2 combined NII, H-alpha, and CIII line imaging(=blue) in the portion of the NICMOS field seen by both instruments. The "NICMOS ONLY" portion uses the same color assignments as describe below. Here is that image:
This looks very good on my RGB flat panel display, but I noticed rather weak on my Sparc monitor (which may be aging).
To download a higher resolution, better fidelity TIFF image CLICK HERE.
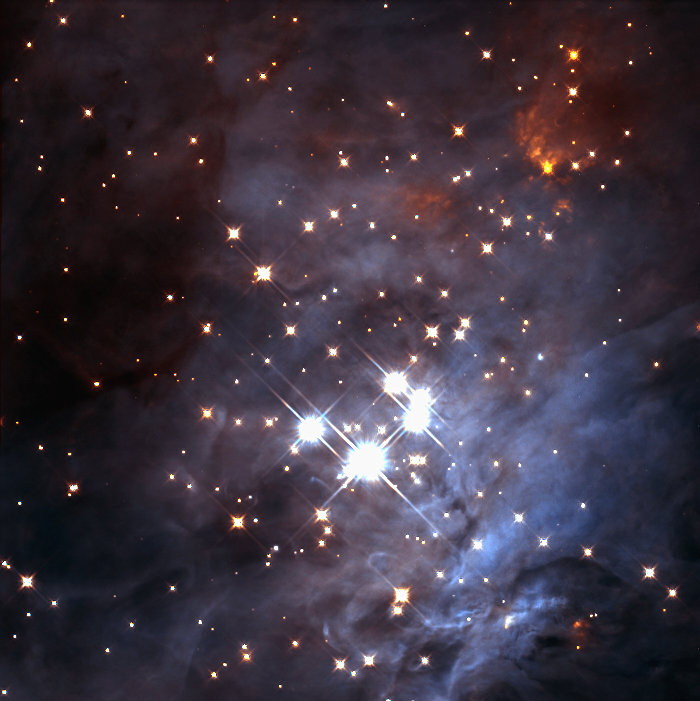
NICMOS ONLY
From the raw imaging data taken in NICMOS GTO program 7217 ("Grism survey of three young clusters", E. Young, PI), I have created a "final" 2-color composite image of the Trapezium field (rendered into false three-color image). It was fairly labor intensive to get to this point, but I think the final product demonstrates that it was worth the effort. The image displayed here is a jpeg (,jpg) file, and hence is not of the highest quality. Higher quality TIFF files may be obtained from the image downlad page.
Data: Nine multiaccum images were obtained in NICMOS camera 3 (52'x52' FOV) in two filters, F160W and F110W. In each filter one image was taken at each point in a 3x3 pattern of offset pointings spaced by 45" from initial field center. The images were obtained on January 12, 1998 at the start of the Camera 3 observing campaign so the HST focus was optimized to provided the best possible optical performance.
Exposure Definition:
-----------------------------------------------------------------------------------------------------------------------------
7        TRAPEZIUM-C NIC3   MULTIAC NIC3-FI F160W    1.600   PATTERN=SPIRAL-DITH,NUM-POS=9,    1   DEF     PAR 8-9 WITH 7
         L                  CUM     X                        DITH-SIZE=45.1,SAMP-SEQ=STEP16,
                                                             NSAMP=11
-----------------------------------------------------------------------------------------------------------------------------
10       TRAPEZIUM-C NIC3   MULTIAC NIC3-FI F110W    1.100   PATTERN=SPIRAL-DITH,NUM-POS=9,    1   DEF     PAR 11-12 WITH 10
         L                  CUM     X                        DITH-SIZE=45.1,SAMP-SEQ=STEP16,
                                                             NSAMP=12
-----------------------------------------------------------------------------------------------------------------------------
Calibration: The raw multiaccum frames were individually calibrated in an analog to the CALNICA pipeline reduction software. Nearly contemporaneous flat fields derived from on-orbit data taken in support of the camera 3 campaign, and IDT generated dark reference files, and bad pixel maps were used in calibration.
Post-Processing: Bad pixels were replaced by 2D Gaussian weighted interpolation of neighbor pixels with r=2 for F110W and r=3 for F160W.
Mosaicing: In each filter the nine calibrated images were registered by shifting and aligning the individual frames. Registration was done by PSF subtractions of stars which were repeatedly observed in the field-overlap regions by minimizing the subtraction residuals and using the ensemble mean computed offsets for each frame. Because of the severe under sampling in Camera 3, and the effects on sampling by the intra-pixel response function in undersampled images, bi-linear interpolation was used to shift the images (using the IDP3 S/W developed bt the NICMOS IDT). The nine frames were then medianed so areas contained data from either1, 2, or 4 original frames.
Scattered Light: In a few cases bright stars fell just outside (or on the edge) of the aperture in some dither positions, resulting in scattered light structural artifacts and/or increased background light. These artifacts, predominantly in the overlap regions (near the aperture edges) were removed by excluding those parts of the effected frames in the overlap regions in the medianing process. In two cases very small artifacts "spilled" onto a piece of sky sampled only in one image. These very small regions were cosmetically removed by treating the regions as "bad" data and filling them with a 2D interpolation of the encircling background using a variable-width (differing for each to-be-replaced pixel) kernal weighting function.
Edge-effects: Data values on the frame boundary rows/columns which improperly scaled due to re-registration were re-normalized to produce no discontinuities in the medianed data values in adjoining rows/columns.
Photometric Calibration: Instrumental photometric gains determined by M. Rieke were adopted in converting from count rates to physical units. F110W: 2.031E-6 Jy/ADU/sec/pixel; F160W: 2.19E-6 Jy/ADU/sec/pixel.
Color combination: The two mosaics were already registered to each other by virtue of the better than 10mas pointing accuracy of the HST pointing control system and no further re-registration was needed. A false "3-color" image (RGB image planes) from only two color data was made as follows. F160W = Red, F110W = Blue, mean(F160W, F110W) = Green. The three color planes (observed R, B, and derived mean) were layered and combined using Photoshop 5.0 with additional (subjective) adjustment to contrast, brightness, saturation, etc. to make a "visually pleasing" image.
HERE IT IS: (see below as well)
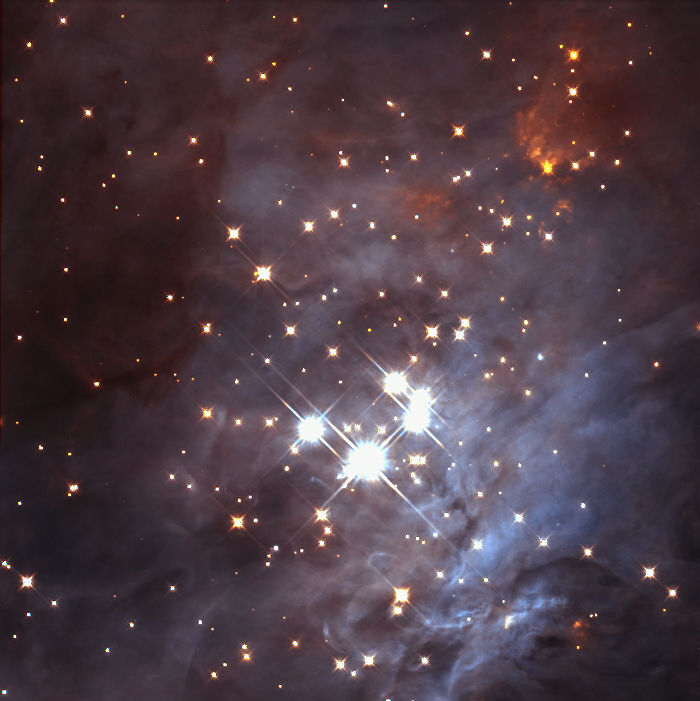
I have also made a somewhat less contrasty version, which flattens the dynamic range a bit. I prefer that as it shows a bit more of the nebulosity, though (for public consumption) it lacks the higher color saturation of the above image. This is all purely subjective.
HERE IT IS:, AGAIN (lower contrast)
Cheers,
Glenn Schneider
gschneider@as.arizona.edu