Following the characterization of the candidate Focal Plane Arrays (FPAs), a preliminary selection has been made for the primary flight units with corresponding camera assignments.
                 ROCKWELL         FPA:    79T0016     79T0011   79T0017
                 REQUIREMENT   CAMERA:       1           2         3

DARK CURRENT       <5                     0.18        -0.04     0.06
(e- per second)                           +/-0.09     +/-0.09   +/-0.10

Noise              <50                    30.16       28.41      33.36
(e-)

# BAD PIXELS     <1967 (3%)               86(0.13%)   74(0.11%)  37(0.056%)
CONVERSION GAIN                           10.32       10.23       12.83
(e- per ADU)

SATURATION (e-)                           184000      173000      205000
(@ .46V bias)
(98% Linearity)

50% CUTOFF                                2.55        2.525       2.52
WAVELENGTH
Shading is absolutely repeatable for image frames clocked in
READOUT NOISE
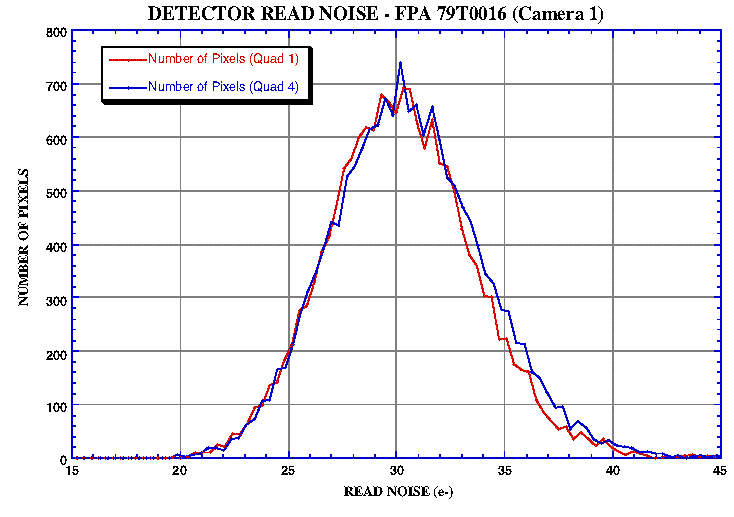
The readout noise characteristics of each of the three flight detectors are quite similar. In general, this noise component is approximately 30 electrons (specific peak values see General Performance Characteristics) with distribution function across all pixels with a FWHM of about 8 electrons. While the 4 quadrents of each FPA has it own set of readout electronics, the readout noise characeristics of all quads in an FPA are very similar. The accompanying figure demonstrates this for quads 1 and 4 of the flight array designated for Camera 1.
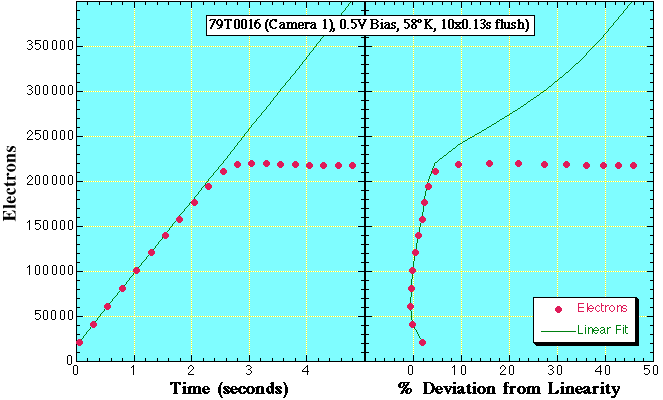
LINEARITY & SATURATION
The NICMOS FPAs exhibit essentially linear response over most of their useful dynamic range. In both the very low, and very high flux regimes (in the later case prior to saturation) a departure from linearity occurs. The non-linear portions of the response curves are highly repeatable and will be characterized on a pixel-by-pixel basis. Linearity corrections, based upon this characterization, will be performed in the data reduction pipeline for the non-saturated regions of detector performance. The accompanying figure illustrates the regimes of non-linearity and saturation for a representative small region the flight array designated for Camera 1. In this figure, the zero-crossing offset is an artifact of the charactizaton testing.
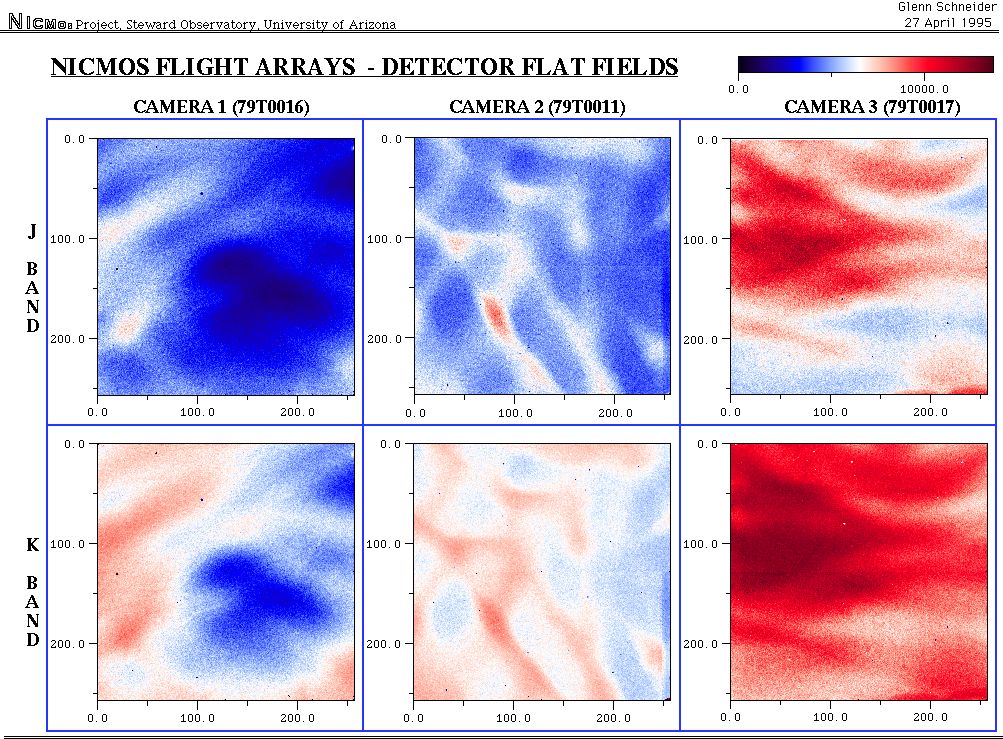
These representative frames, in the J and K spectral bands, were imaged with the primary flight candidate arrays. The flats were taken with an incandescent Quartz-Tungsten-Halogen lamp illuminating a diffuser at the entrance pupil of a dewar optical system. The FPAs were operated at flight temperatures of 58-degrees K using a 12.5 microsecond pixel clock, and biased at 0.95 Volts. Pulsed resets were applied to the array elements, and integration times of 250 milliseconds were used.
Each flat field image was averaged from 10 co-added frames, and dark current has been removed by subtracting reference dark frames. The resulting flat fields have been normalized to compensate for detector and wavelength dependent QE variations. Note not only the structural difference in the flat fields, but the color dependence as well. The intensity scale provided with the flats is in counts (ADUs), where 1 ADU is approximately 10 electrons.