Is ACRIM 3 Sensitive to Venus's Atmosphere from a Single Transit Event?
At the time of the transit, between contacts II and III, the planetary disk
of Venus occulted 0.0942% of the solar photosphere. But, with an optically
opaque atmosphere to 60 km (beyond the mesopheric cloud layer) above the
surface the areal coverage was 0.0961%, thus (geometrically) blocking an
additional 0.002% of the received TSI (if not preferentially forward scattered,
refracted, or re-radiated by the atmosphere). We tested the ability
to discriminate against a 1% equivalent increment in an Earth-like planetary
radius (by the presence of Venu's opaque atmosphere) in light of both spatial
and temporal solar photospheric "surface" brightness (PSB) variations.
The solar PSB decreases radially from the heliocenter because of limb darkening.
The PSB is also instantaneously non-heterogenous on angular scales of ~ 1"
due to solar granulation, and on larger scales due to features such as sunspots.
Thus, the TSI received at ACRIM (and corrected to 1AU) is expected
to vary as Venus occults different portions of the photosphere during its
transit due to spatial variations in PSB, separate from also expected temporal
variations. We investigated the likely amplitudes of PSB variations after
compensating limb darkening as they may affect ACRIM 3 measures of TSI with
contemporaneous high-resolution imagery obtained with the TRACE spacecraft
in its very spectrally broad WL channel (appx. 0.1 - 1.0 microns).
We performed temporally and spatially resolved (and independent) limb-darkening
corrected differential photometry of regions flanking the location of Venus
as it transited (Fig 1) the photosphere. With that we obtained statistical
expectations of the levels of variability in TSI due to partial photospheric
occultation at the angular scale of Venus (Fig 2).
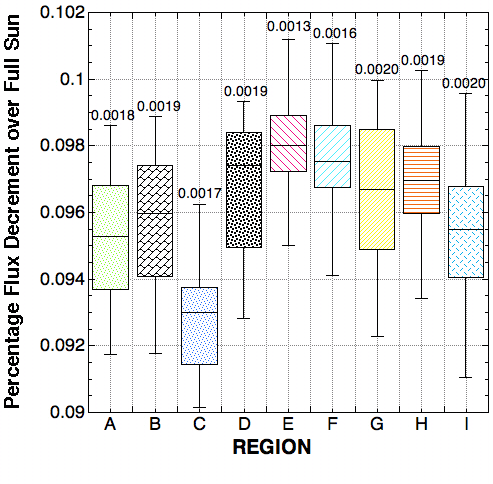
- Temporal changes in TSI due to Venus occultation of any fixed
region of the Sun tested (e.g., denoted A-I in Fig 1) were found to be
~ +/- 0.0018% one-sigma (compared to a 0.0019% expected change in signal)
with inter-region variations in internal dispersions of +/- 0.00022%.
Hence, a sensitivity to the presence vs. absence of a Venus-like opaque planetary
atmosphere was tested at only a 1.05-sigma level of confidence.
- TSI variations due to spatial anisotropies in PSB on Venus-size
angular scales were found dispersed by ~ +/-0.0015% one-sigma about an expected
decrement in TSI of 0.0961% due to the presence of Venus imposed on the photosphere
with compensation for limb-darkening (I.e., a 1.3 sigma "detection" of the
atmosphere of Venus).
The virtual equivalence of the two measures and their uncertainties implicates
no significant systematic effects in this data set from large spatial scale
PSB variations (after proper limb-darkening compensation) in excess of limiting
detection sensitivities from temporal effects.
The magnitudes and dispersions of both the temporal and spatial variations
imply, however, only a very marginal ability (at best) to radiometrically
discriminate the presence vs. absence of a Venus-like opaque planetary atmosphere
for an Earth-sized planet - from a SINGLE transit event - not because of
instrumental limitations, but because of the intrinsic temporal and spatial
PSB chaaracteristics of solar-like stars.
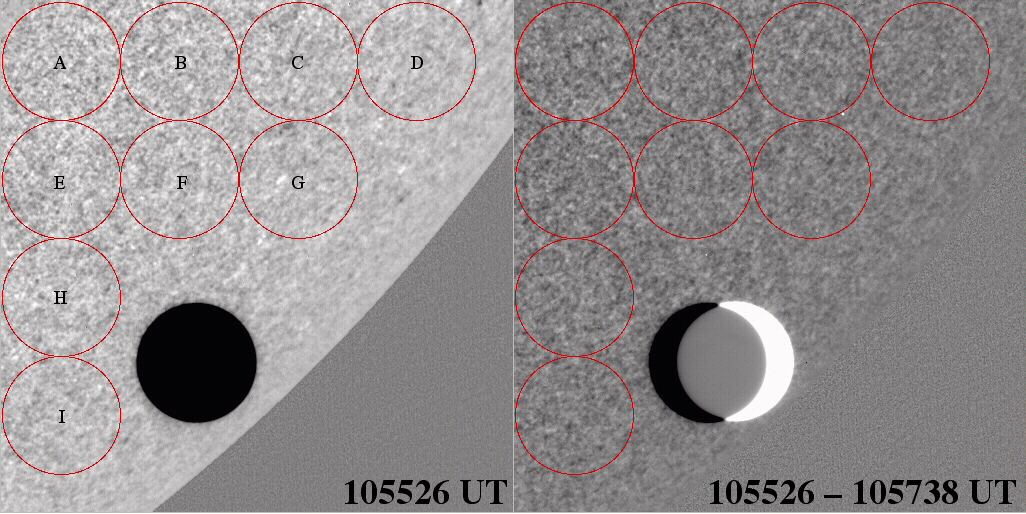
Fig 1. Left: Representative TRACE WL image (one of 100 time-sliced images
for this spacecraft pointing spanning 40 minutes of time) of Venus transiting
the solar photosphere with photometric apertures used (each enclosing 10,
923 TRACE pixels) to evaluate the temporal and spatial variability of the
PSB on the size scale of Venus seen in projection. Right: Difference
image (at same display dynamic range) illustrating the change in PSB at the
cadence of ACRIM 3 sampling (also illustrating the movement of Venus over
132s at the indicated times).
Figure 2. Variation in total solar flux density decrement (0.1 to 1.0 microns)
due to photospheric occultation by a Venus-size planet arising from temporal
and spatial PSB variations (illustrated for 9 regions of the Sun as in Figure
1 during the 8 June 2004 Venus transit). Boxes indicate upper and lower quartiles
about measured medians (black lines) of 100 samples. Bars indicate
+/- 2-sigma variations about sample means, with 1-sigma (in delta percent)
indicted above. (CLICK HERE FOR
HI-RESOLUTION FIGURE)