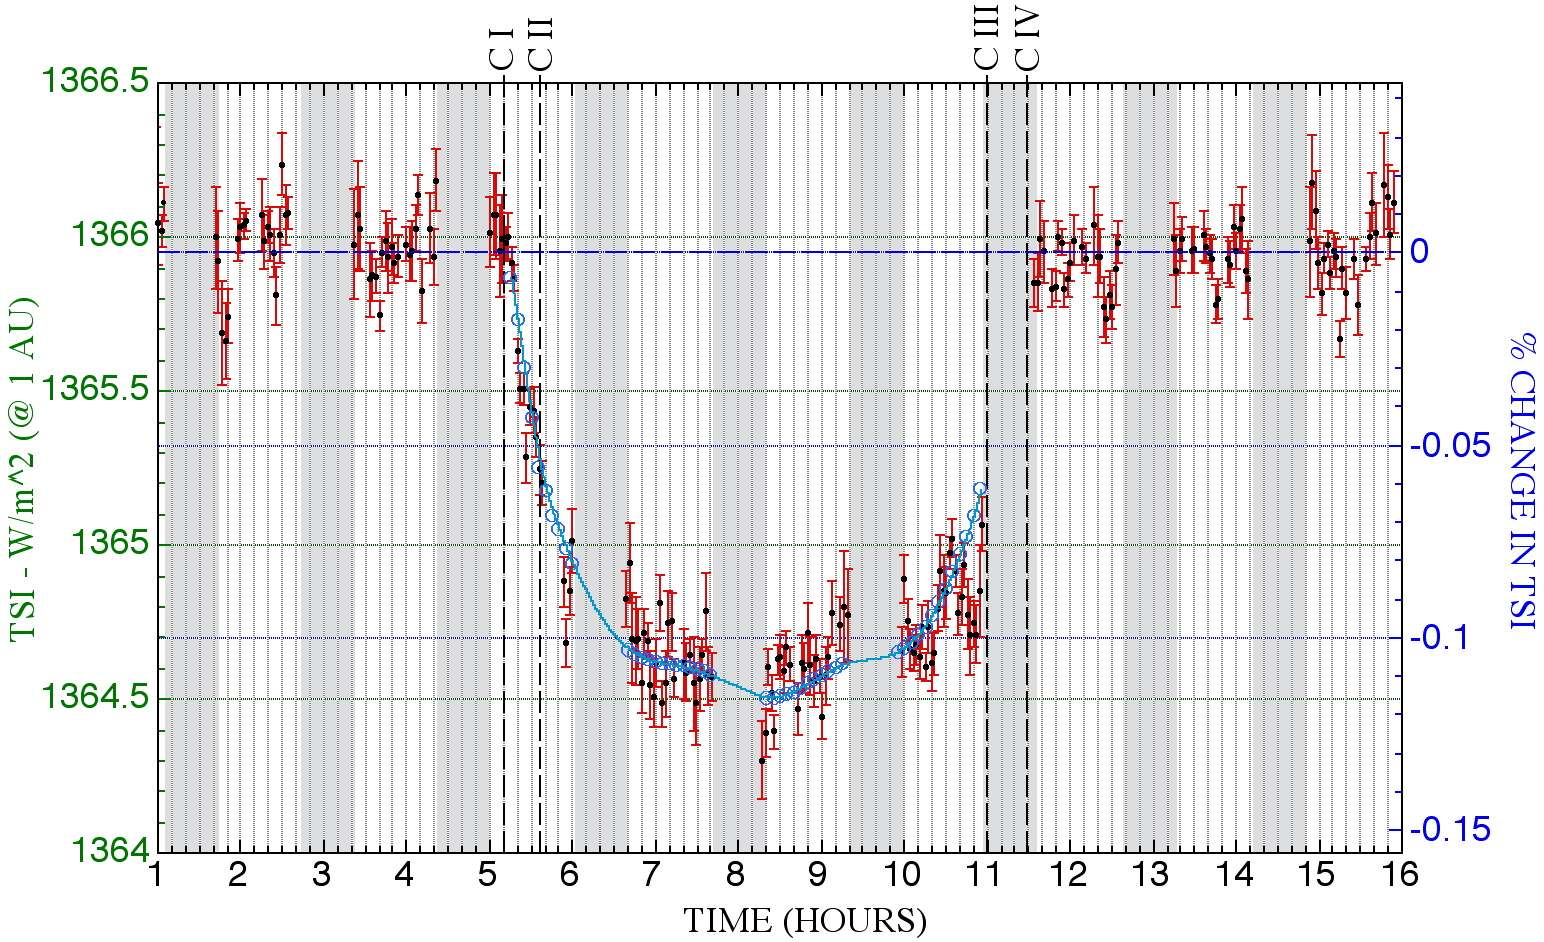
The black points, and the associated red error bars,
are the ACRIM 3 measures and their 1-sigma uncertainties. The
blue circles are expected values from a geometrical orbit and solar
limb darkening model (discussed below), during the transit (at 5 minute
intervals) while the Sun was visible to ACRIMSAT. The Sun, as seen from
ACRIMSAT, was occulted by
the Earth during the times indicated by the regions of the vertical
gray bars
in the above graph, thus no data were obtained during those intervals.
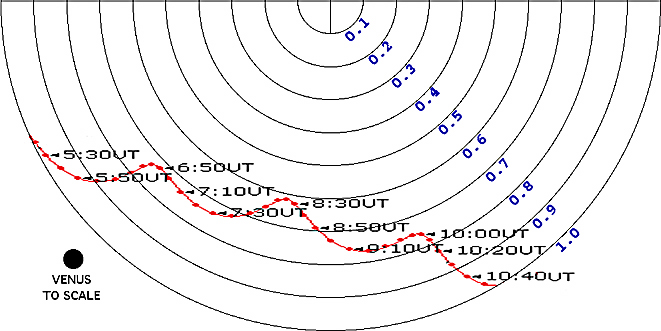
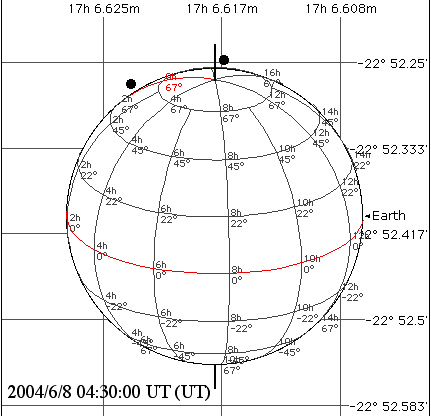
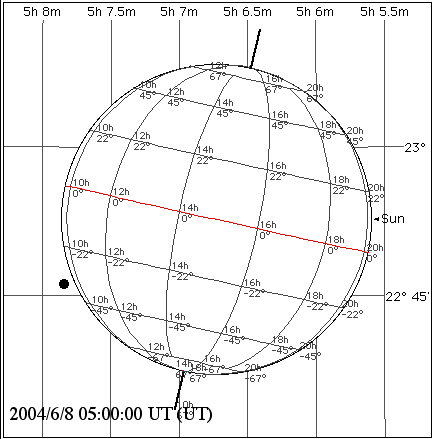
THE ACRIMSAT "VIEW" OF THE TRANSIT
The path of (the center of) Venus, as seen from
ACRIMSAT, is depicted in the figure below (North is up in the figure).
As previously noted, the planetary parallax (shifting of the
line-of-sight to Venus) induced by the spacecraft orbit, projected onto
the disk of the Sun causes periodic spatial and temporal modulations in
the location of Venus as it traverses the solar disk. The
"vertical" amplitude variation (i.e., in the North/South direction)
result from the near-polar ACRIMSAT orbit. As Venus is of similar size
as the Earth, and as ACRIMSAT is in a low Earth orbit, the vertical
excursions are also comparable (but a bit larger than) to the diameter
of Venus. The "horizontal" (East/West) component manifests itself
in non-linear spacings in the planetary position along its projected
path in equal time intervals. This results from the
ACRIMSAT orbit plane not being in the line-of-sight direction to the
Sun. Note: with
TRACE
the modulation is more closely sinusoidal, as its orbit is
perpendicular to the Earth/Sun line, but deviates from a linear (in
spacecraft orbital phase angle) sinusoid because of the planet's
orbital motion about the Sun.
LIGHT CURVE ASYMMETRIES
As a result of the reflective spacecraft parallactic motion of Venus,
its path across the Sun "nods" in heliocentric radius (r). A
table (in five minute increments) of the positions of Venus against the
solar disk, relative to the heliocenter as seen from ACRIMSAT is given
HERE. This motion induces
asymmetries in the ACRIM radiometric "light curve" as Venus occults
portions of the solar disk of differing surface brightnesses (flux
densities) in a radially dependent manner due to solar limb darkening.
One can see that during ingress Venus crosses from r = 1.0 to r =
0.9 (where the limb darkening function has a very steep gradient) twice
as
slowly as it does from r=0.9 to r = 1.0 upon egress. Hence, the
downward
slope of the ingress light curve will be more shallow than during
egress.
Additionally, one would expect small amplitude, orbit periodic
variations
in the intensity variations measured by ACRIM Venus "oscillates"
between
the brighter (smaller r) portion of the photosphere and positions
closer
to the solar limb (larger r). This is, at least in part for some of the
"wiggles"
which are seen at the "bottom" of the light curve, though some
variation
may also be due to intrinsic variations in the global TSI over the same
time interval, and also as Venus occults regions of the photosphere
which
may be intrinsically brighter or dimmer (as discussed later).
THE EFFECT OF LIMB DARKENING
A statistically significant shallow diminution in the radiometric
flux density is seen after second contact but before mid transit, i.e.,
approximately -0.04% at 05:50 UT and approximately -0.08% at 06:15 UT
compared
to approximately -0.10% at mid transit, and a corresponding gradual
rise
before the loss of data due to Earth occultation upon egress.
This
is attributable to radially differentiated solar limb darkening, with a
strong
photospheric radial surface brightness gradient as the limb of the Sun
is
approached. At 05:50 UT the center of Venus was app 0.933 solar radii
from
the heliocenter, whereas at mid-transit (appx 08:35 UT) the center of
Venus
was 0.650 solar radii from the heliocenter. This non-linearity in
impact
distance with time arises, primarily, from the modulation in Venus’s
heliocentric
velocity vector w.r.t. the limb (e.g., affecting the “limb crossing
angles”)
induced by ACRIMSATs orbital parallax.
A MODEL LIGHT CURVE
We constructed a “model” light curve by building a series of
two-dimensional synthetic images of the Sun, geometrically occulted by
Venus as determined by the ACRIMSAT orbital ephemeris.
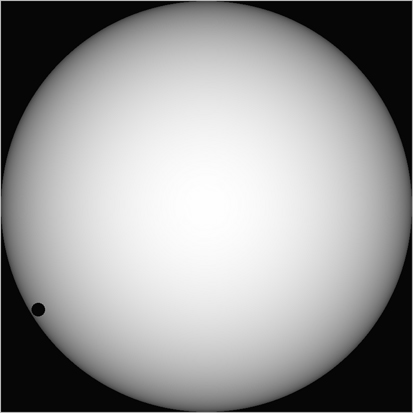
Synthetic transit image for 05:40UT as seen from ACRIMSAT.
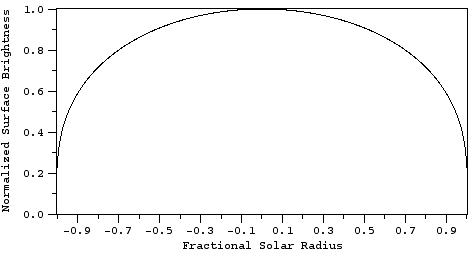
The synthetic solar images were limb-darkened with a resulting
photospheric surface brightness radial profile, F(u), parametrically
represented as suggested by
Hestroffer and
Magan (Astron. & Astroph. 333, 338, 1998):
F(u) = 1 -
a(1-u^b)
where: u = sqrt(1-r^2)
with r being the fractional solar radius.
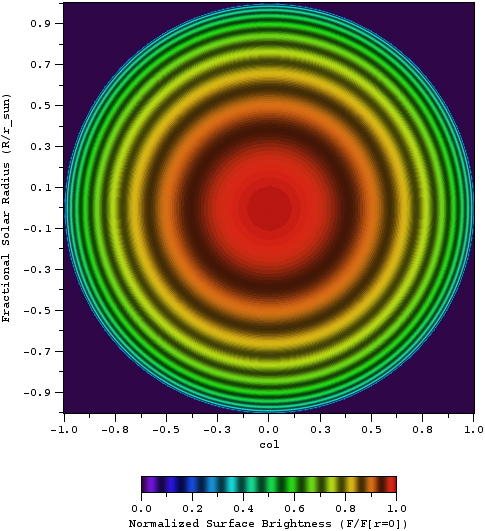
This limb darkening function (in central intensity normalized
form) and as used to generate a limb-darkened model image (shown 7.5%
intensity contour intervals) are illustrated below:
A few other limb darkening
references:
Greve & Neckel 1996 (2000-3000 angstoms)
Pierce & Slaughter 1977 (3033-7297 angstroms)
Koutchmy, Koutchmy & Kotov 1977 (1-4 microns)
Petro, Foukal, Rosen, Kurucz
& Pierce 1984 (optical
variability)
LIGHT CURVE FITTING
With iterative convergence, minimizing the sum of the squares of the
residuals in the observed minus computed model data, the model light
curve
which best fits the ACRIM 3 data has
F(u) characterized with
a = 0.85 and
b = 0.80, and recovered times of
contacts very closely agreeing with expectations based upon the
spacecraft orbital ephemeris.
|
VENUS TRANSIT CONTACT TIMES FROM ACRIMSAT
Contact I (external tangency at ingress) = 05:10:19
UT
Contact II (internal tangency at ingress) = 05:35:35
UT
Contact III (internal tangency at egress) = 10:59:15
UT
Contact IV (external tangency at egress) =
11:29:30 UT
|
The total area-integrated flux density (i.e., the TSI) “predicted” by
the limb-darkened model as Venus transits the solar disk is compared to
the ACRIM 3 radiometric measures for times when the Sun was visible to
ACRIMSAT (overlaid in blue on the light curve plot).
HOW GOOD IS THE FIT?
We use the as-measured TSI variations in the flanking out-of-transit
radiometry to assess "how good" (or deficient) our relatively simple
model
light curve fits the data. I.e., how much of the fit residuals
are
due to instrumental measurement errors and intrinsic solar variations
compared
to imperfections in the model itself. "Variations", here, not
only
include temporal variations in (area integrated) TSI but also spatially
as
Venus covers different parts of the photosphere that are not isotropic
in
intensity on small spatial scales.
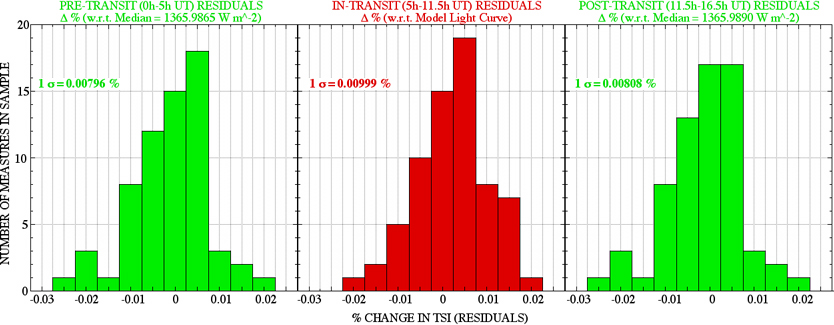
The left and right panels in the figure below show the distribution
functions of the light curve fit residuals from three contiguous orbits
(approximately 5 hours) of pre and post transit data (green),
immediately before C I and after C IV. The median TSI
measured for each of those periods differ by only 0.0002%, i.e.
"constant" within the measurement errors. Conceivably there could be
larger intrinsic solar variations during the time interval of the
transit itself. The measured variation in TSI during these 5-hour
flanking periods is approximately 0.008% at the 1 sigma level.
The
1-sigma residuals from the model light curve fit to the data during the
period
of the transit (red) are approximately 0.01%.
The difference in the dispersion in in-transit compared to
pre/post-transit model light curve fit residuals is +25% in "
as
measured" TSI variability (after subtracting out the model light
curve). This in-transit increase in the dispersion in TSI of
0.002% is an order of magnitude larger than the dispersions about the
median as-measured TSI's before and after the transit. One may posit
one or more instrumental (1), systematic (2), and or real
physical effects (3 and 4) contributing to this increase as delineated
below:
- Uncertainties in the end-to-end wavelength-dependent system
responsivity function for ACRIM under its very broad pass band
(i.e., its spectral sensitivity). These uncertainties are
likely insignificant based upon the ACRIM 3 cavity design and
pre-launch testing.
- Insufficient fidelity in the limb darkening model. A
quadratic model may be better, and could be tested, but a higher order
(multi-parametric) model is likely unjustified given the interrupted
phase coverage and single-epoch-only nature of the light curve.
- The effect of the atmosphere of Venus itself.
- The effect of Venus occulting regions of the photosphere
differing in brightness on small spatial scales.
Neglecting or better characterizing (1) a higher order limb-darkening
model (2) may be employed and tested by by parametric variation bounded
by
the instrumental spectral sensitivity calibration. With that, rigorous
detection
limits for the planetary atmosphere (3) may be ascertained, within the
uncertainties in the local variations in photospheric intensity at the
spatial scales
of Venus (4).
VENUS 2004 - A SURROGATE TO AN EXTRASOLAR TERRESTRIAL
PLANETARY TRANSIT
What measured TSI variation resulted from position-dependent
photospheric occultation for the actual “path” that Venus took is (and
must remain) conjectural, as ACRIM 3 “sees” the Sun as a spatially
unresolved source. This will also be case in the analysis of extrasolar
terrestrial planet transit light curves of very high photometric
precision (e.g., such as those to be obtained by the
Kepler mission).
At the time of the transit, between contacts II and III, the planetary
disk of Venus occulted 0.0942% of the solar photosphere. But, with an
optically opaque atmosphere to 60 km (beyond the mesospheric cloud
layer) above the surface the areal coverage was 0.0961%, thus
(geometrically) blocking an additional 0.002% of the received TSI (if
not preferentially forward scattered, refracted, or re-radiated by the
atmosphere). We tested the ability to discriminate against a 1%
equivalent increment in an Earth-like planetary radius (by the presence
of Venus's opaque atmosphere) in light of both spatial and temporal
solar photospheric "surface" brightness (PSB) variations.
The solar PSB decreases radially from the heliocenter because of limb
darkening. The PSB is also instantaneously non-heterogenous on angular
scales of ~ 1" due to solar granulation, and on larger scales due to
features such as sunspots. Thus, the TSI received at ACRIM (and
corrected to 1AU) is expected to vary as Venus occults different
portions of the photosphere during its transit due to spatial
variations in PSB, separate from also expected temporal variations. We
investigated the likely amplitudes of PSB variations after
compensating limb darkening as they may affect ACRIM 3 measures of TSI
with contemporaneous high-resolution imagery obtained with the TRACE
spacecraft in its very spectrally broad WL channel (appx. 0.1 - 1.0
microns).
We performed temporally and spatially resolved (and independent)
limb-darkening corrected differential photometry of regions flanking
the location of Venus as it transitedthe photosphere. With that we
obtained statistical expectations of the levels of variability in TSI
due to partial photospheric occultation at the angular scale of Venus.
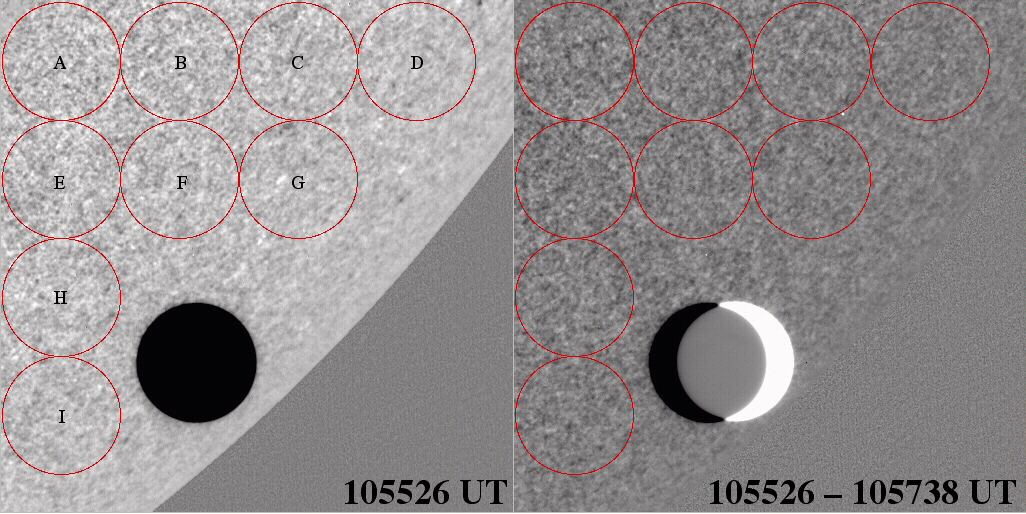
Left: Representative TRACE WL image
(one of 100 time-sliced images for this spacecraft pointing spanning 40
minutes of time) of Venus transiting the solar photosphere with
photometric apertures used (each enclosing 10, 923 TRACE pixels) to
evaluate the temporal and spatial variability of the PSB on the size
scale of Venus seen in projection. Right: Difference image (at
same display dynamic range) illustrating the change in PSB at the
cadence of ACRIM 3 sampling (also illustrating the movement of Venus
over 132s at the indicated times).
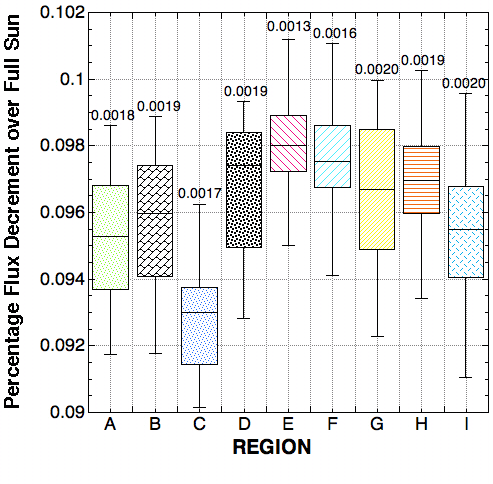
Variation in total solar flux density
decrement (0.1 to 1.0 microns) due to photospheric occultation by a
Venus-size planet arising from temporal and spatial PSB variations
(illustrated for 9 regions of the Sun as in the previous figure, during
the 8 June 2004 Venus transit). Boxes indicate upper and lower
quartiles about measured medians (black lines) of 100 samples.
Bars indicate +/- 2-sigma variations about sample means, with
1-sigma (in delta percent) indicted above.
-
Temporal changes in TSI due to Venus occultation of any
fixed region of the Sun tested (e.g., denoted A-I in Fig 1) were found
to be +/- ~ 0.0018% one-sigma (compared to a 0.0019% expected
change
in signal) with inter-region variations in internal dispersions
of
+/- 0.00022%. Hence, a sensitivity to the presence vs. absence of a
Venus-like opaque planetary atmosphere was tested at only a 1.05-sigma
level of confidence.
-
TSI variations due to spatial anisotropies in PSB on
Venus-size angular scales were found dispersed by ~ +/-0.0015%
one-sigma about an
expected decrement in TSI of 0.0961% due to the presence of Venus
imposed
on the photosphere with compensation for limb-darkening (I.e., a 1.3
sigma
"detection" of the atmosphere of Venus).
The virtual equivalence of the two measures and their uncertainties
implicates no significant systematic effects in this data set from
large spatial scale PSB variations (after proper limb-darkening
compensation) in excess of
limiting detection sensitivities from temporal effects.
SUMMARY
The spatially unresolved Venus transit light curve obtained by ACRIMSAT
(and a similar one obtained by SORCE/TIM) is the closest proxy to an
extrasolar terrestrial planetary (ETP) transit which exists. Given our
apriori knowledge of this star/planet system geometry and properties,
this data set may be exploited uniquely to test the detectability of
ETP transits using methods contemplated by future space-based
planet-finding missions. With sufficient photometric precision, proper
characterization of the effects of stellar limb-darkening
can yield information on the vertical structures in stellar
atmospheres,
and have the potential of informing of the existence of a transiting
planetary
atmospheres as well.
The amplitudes and dispersions of both the temporal and spatial solar
PSB variations limit the ability to radiometrically discriminate with
sufficient statistical significance the presence vs. absence of a
Venus-like opaque planetary atmosphere for an Earth-sized transiting
planet
. ACRIM 3 has a
single
measure (i.e., 2.2 minute
"shutter cycle") radiometric precision of 10
-4. By
comparison, the goal for Kepler differential photometry is a factor of
5 better on timescales of 2 to 16 hours will yielding 4-sigma planet
detections for a single transit. But, the effects of intrinsic
solar-like PSB variations as assessed from ACRIM 3 and TRACE measures
of the recent Venus transit would likely preclude the photometric
inference of planetary atmospheres for Earth-size planets of solar-like
stars. Hence, alternate stratagies such as spectroscopic
capabilities on subsequent missions (e.g., an integral field
spectrograph on TPF-C) must be considered.
ACKNOWLEDGMENT
We are indebted to Richard C. Willson, Principal Investigator for ACRIM
experiments, for providing us with such an excellent and unique data
set, and to the ACRIM team for building and commissioning such a fine
instrument.
Link to 2004 Transit of Venus Web Site at Williams College