Big Bear Solar Observatory (BBSO)
Big Bear Lake, California
Latitude: 34° 15.505' N, Longitude: 116° 55.278' W, Altitude: 2060 m
Glenn Schneider (Steward Observatory, The University of Arizona)
in collaboration with Jay Pasachoff (Williams College)
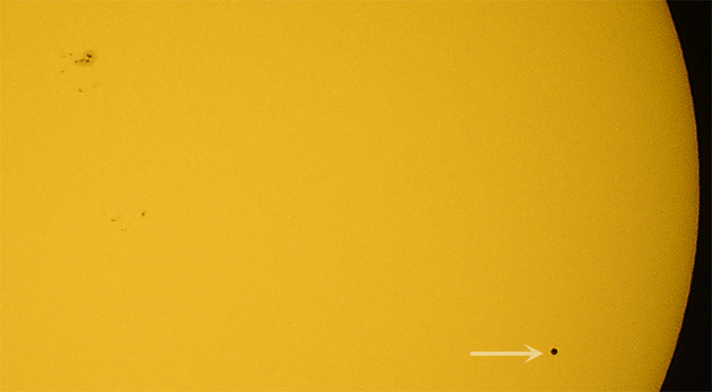
MERCURY IN TRANSIT
Questar 3-1/2", f/16, (EFL 1422mm), ISO 500, 1/4000 s, Questar ND 5 full aperture filter, Nikon D600
CLICK THE ABOVE IMAGE TO SEE AT 2X SCALE
With the advent of the 9 May 2016
Transit of Mercury (ToM2016), it was hard to fathom that nearly a
decade had passed since the prior ToM (8 November 2006) that I had
observed from the Meese Solar Observatory on Haleakala. TSE 2016 would
be "mostly" visible from the southwest USA (where I live), with the
event already underway at sunrise. While I could have watched
that in situ from my back
yard in Tucson (my favorite place for lunar
eclipses of convenience), the Big
Bear Solar Observatory (BBSO; operated by the New Jersey Institue
of Technology) with its 1.6 meter diameter
adaptive optics New
Solar Telescope (NST) was only an 8 hour drive away. There I
joined with long-time collaborator in solar transit studies, Jay
Pasachoff, and the BBSO staff (many thanks to all!) exploiting the
Adaptive Optics
(AO)-corrected seeing provided by NST for unprecedented ground-based
imaging of a Mercury transit. For ToM2016, the disk of Mercury had an
apparent angular diameter of appx. 12 arcseconds and was locked to the
AO wavefront-error control system for AO-corrected diffraction-limited
imaging. The first appx 3 hours of the transit after local
sunrise, however, could not be observed with NST as the Sun was then
still too low to the horizon for telescope/AO observations.
SUNRISE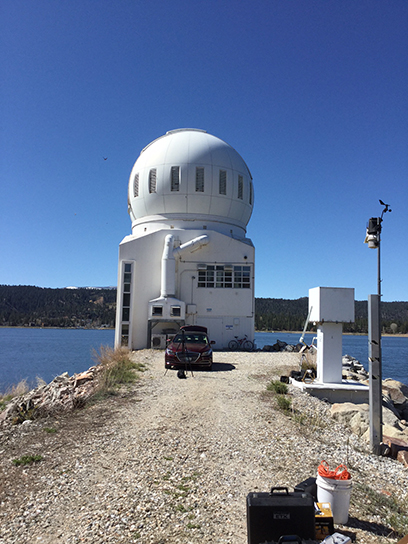 Big Bear Solar Observatory 1.6 m telescope building |
 Glenn Schneider on observing floor of 1.6 m NST |
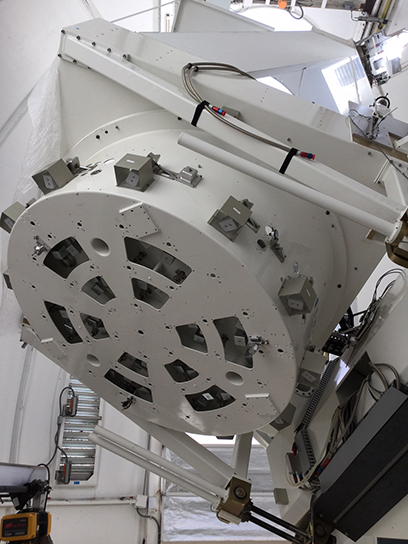 Telescope back-end: primary mirror housing |
From Big Bear Lake, the transit -
with Mercury obscuring 0.0044% of the solar disk by area - was well in
progress for some time before local sunrise. For purely esthetic
reasons, Evan Zucker (who joined us for the event with his son Alex
from San Diego) and I did want to catch the "dot" of Mercury on the
solar disk at sunrise. The topography of and around the lake was
such that, a priori known, an
astronomical horizon could not be obtained. So, we located at the
southwestern extremity of BB lake, near the dam, that would provide a
view toward the rising sun over a 12 km distant slopping mountain ridge
appx 1.7 deg above the astronomical horizon.
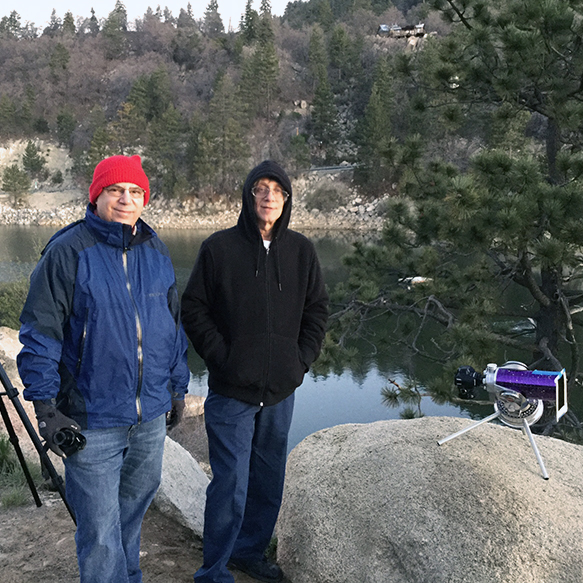 Glenn Schneider (r) and Evan Zucker (l). BB lake dam photographing sunrise. Questar 3-1/2", f/16, ISO 200, 1/20 s, ND 5 filter, Nikon D3000 -----> |
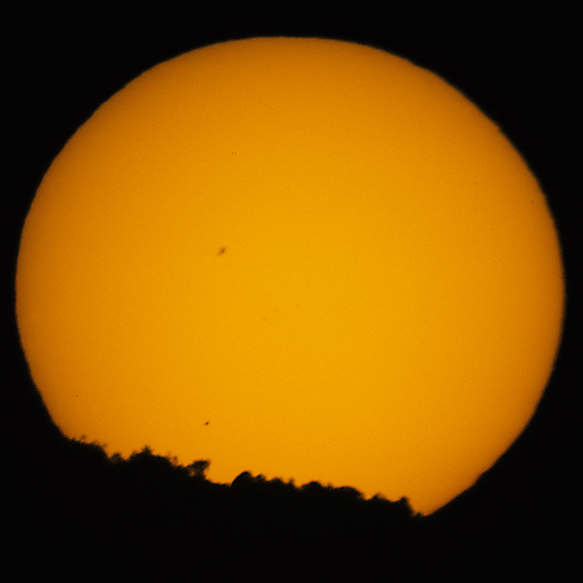 Clearing the distant-ridge
tree-line: Sunspot above, Mercury below.
CLICK HERE to see a sunrise "movie". |
NST - 1.6 m telescope - solar photospheric transit with AO waveront error control
The NST adaptive optics
wavefront-error control system was used continuously throughout the
transit to provide high-fidelity images of the silhouette of Mercury
back-lit by the solar granualtion at a rate of one frame every 12
seconds. The AO system maintained lock (ability to
correct the temporally variable wavefront) from imaging start at
16:03:46 UTC until just after geometrical contact 3 when, after
solar-limb crossing, the wavefront control referential was lost.
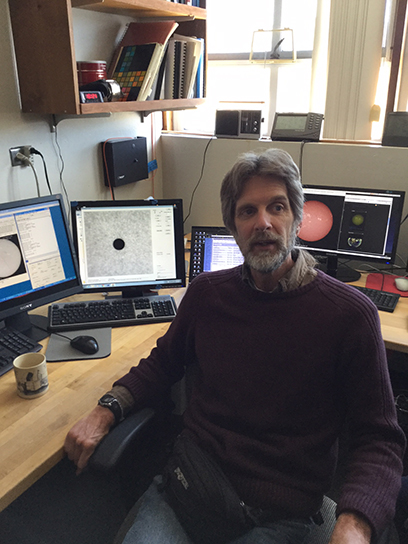 Claude Plymate - Telescope Engineer/Chief Observer in the control room |
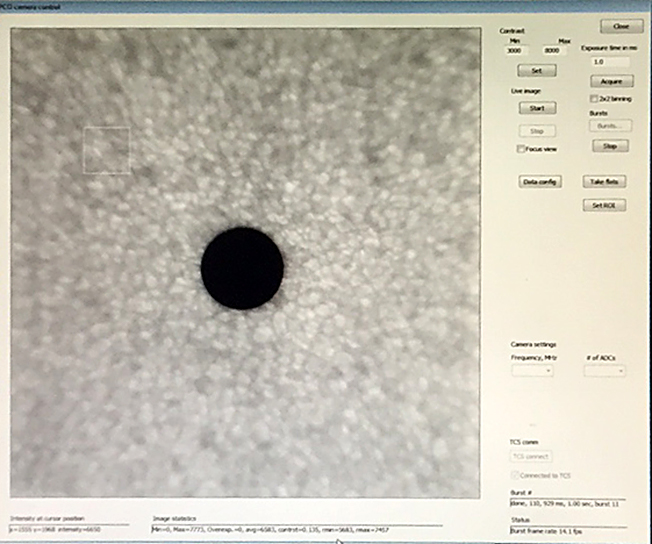 Real-Time display during transit -- AO lock on Mercury against solar granulation CLICK HERE to see the NST transit movie (patience: 25 Mby file) |
--> CLICK HERE to see more
slowly rendered short movie from this point to near C4 (with the
AO/tracking system compromised).
Here are the last three frames (better
stretched to account for solar limb darkening) leading to C3 (predicted
geometrical at 18:39:06 UTC) just before AO lock was lost in the next
frame:

AO-corrected Black-Drop Effect
(For background information on the Black Drop Effect see: Schneider, G., Pasachoff, J. M., and Golub, L., 2003, Icarus, 168, 249.)
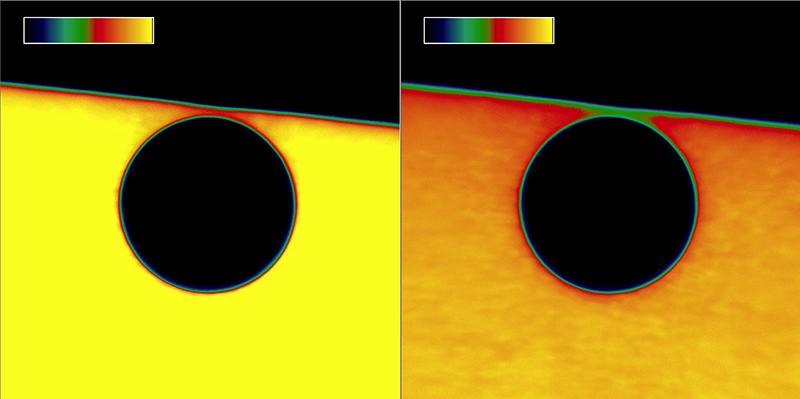
In a bit more detail, below are two display images (same data) from the 16-bit NST data very last frame, acquired taken at UTC 183856, *JUST* before the AO-lock was lost. This is 10 seconds before the predicted geometrical time of 3rd contact from BBSO (at UTC 183906). Recall that the imaging cadence was nominally 12 seconds. Note the diminutive black drop (FYI, wavelength 705.7 nm). The very next frame, taken at UTC 183908, 2 seconds after geometrical 3rd contact, is (unfortunately) badly blurred with the wavefront control system going open-loop sometime in the seconds prior to that next image. It was taken, of course, but not really of any use - nor those after that are even worse or non-existant!
The right frame is similar, but over a bit wider log10 display stretch , from also [3.0] but to [3.7] {dex} counts/second. i.e., a factor of 5.01 is surface brightness where at the higher cut-off you can see photospheric granulation structure. In this stretch, the morphological "evolution" in the black drop (in surface brightness) may be even a bit more apparent.
(Oh, I WISH we had more frames closer to C3 and at higher cadence. But, "beggars can't be chooses", and with this ONE we got quit lucky with the AO system hanging in almost right up to the limb tangency!)
EGRESS - 0.089 meter (Questar 3-1/2") telescope with natural seeing
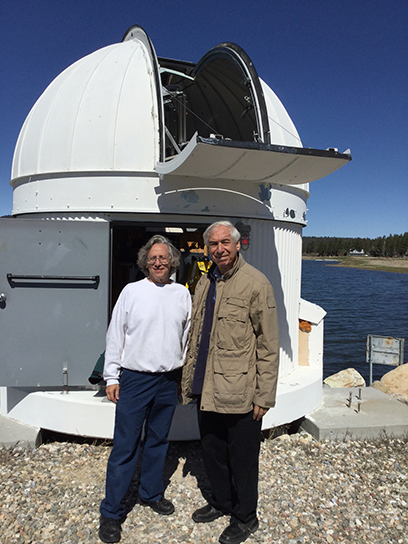 Glenn Schneider (l) & Jay Pasachoff (r) |
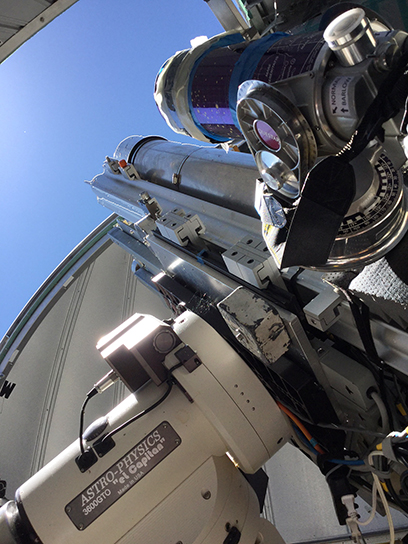 Questar "piggy-backed" on tracking telescope spar |
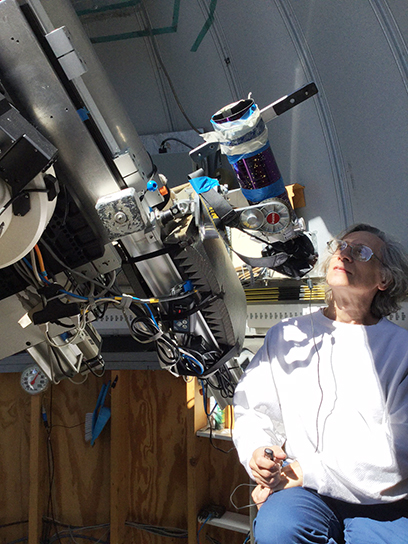 Glenn Schneider checking telescope alignment |
Meanwhile... in parallel, Glenn
Schneider and Jay Pasachoff had set up a 3-1/2" Questar for full-disk
white-light imaging of the transit, "piggy-backed" on a smaller
telescope in a separate dome outside of the 1.6 m telescope building
(photos above). After an initial set of images at ~ 16:00 UTC
(partially vignetted by the edge of the dome slit edge, alleviated
thereafter) an image sequence of Mercury trekking across the sun in the
latter part of the transit was acquired starting ~ 16:30 UTC with
a loose cadence of appx. 10 minutes until 6 minutes before contact IV
when the cadence was increased to 4 frames per minutes.
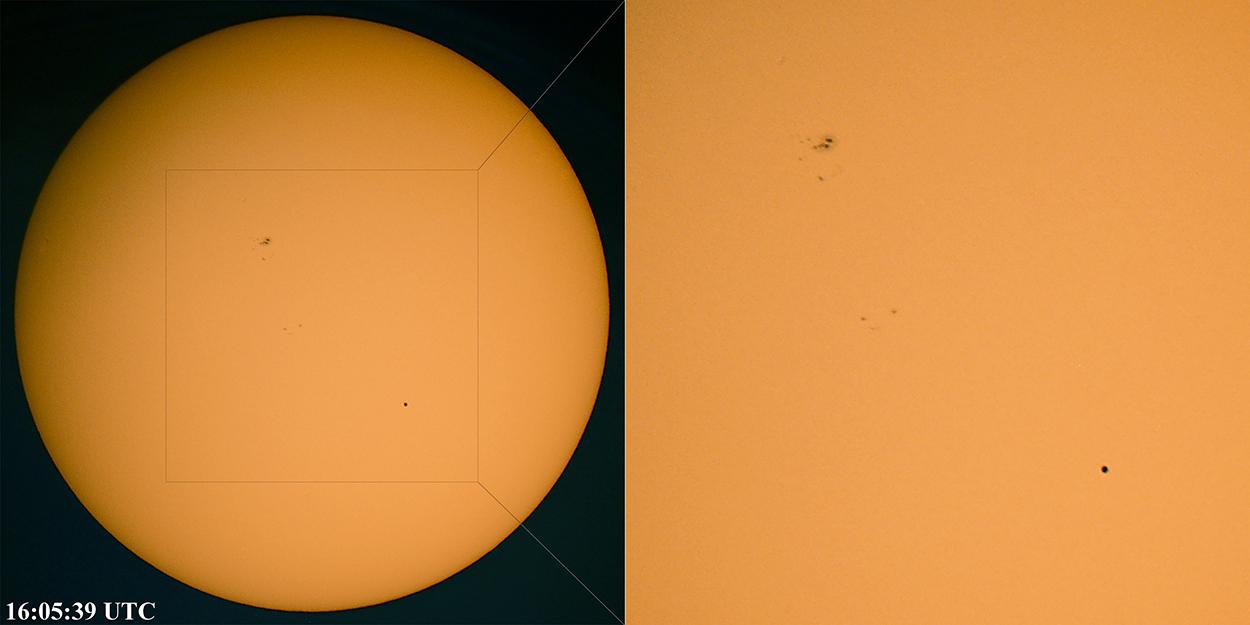
Questar 3-1/2", f/16, (EFL 1422mm), ISO 500, 1/1600 s, Questar ND 5 full aperture filter, Nikon D600
CLICK THE ABOVE IMAGE TO SEE AT 2X SCALE
CLICK ->HERE<- to see an animated image sequence of in-transit frames from 16:00 to 18:43 UTC
(if not playing in your web browswer, download the mp4 file and play locally)
During egress, pre-C3 to post-C4, a
constant-cadence time-resolved image sequence was obtained. This
sequence of 24 images below (time increasing top left to bottom right)
are sub-arrays extracted from full-sun images taken with the 3-1/2"
Questar: Image cadence one frame every 15 seconds starting 6
minutes before C4.
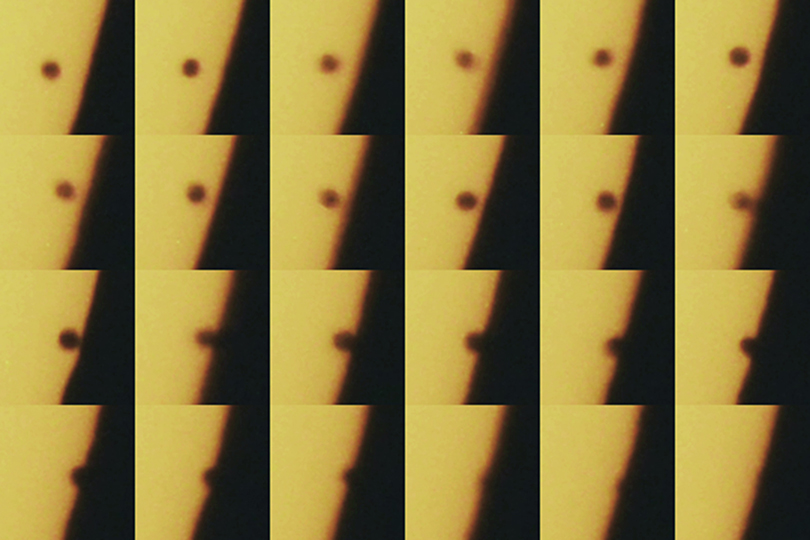
Questar 3-1/2", f/16, (EFL 1422mm), ISO 500, 1/2000 s, Questar ND 5 full aperture filter, Nikon D600
Image sequence at four frames per minute top-left to bottom-right.
CLICK THE ABOVE IMAGE TO SEE AT 2X SCALE
RETURN to Glenn Schneider's Home Page
