HST GO/DD 13067 F763M Test Exposures
(Last update: 15 Aug 2012 - Glenn
Schneider)
EXECUTIVE
SUMMARY
Based on test exposures acquired in GO/DD 13067 Visit 15, appx 5 weeks
ahead of the Jovian transit of Venus (J/ToV2012), we must reduce the
preliminary-Planned F763M commanded exposure times from 0.7s to
0.5s in all F763M exposures in Visits 01-14. I will coordinate
this implementation change with Tony Roman at STScI.
BACKGROUND
INFORMATION
On 14 Aug 2012 UT, three test exposures in the F763M (11% wide "i"
continuum) band were taken of the full disk of Jupiter in the WFC3/UVIS
channel centered (via POS TARG) in the 2K^2 2-C subarray. The
purpose of these exposures were to refine the exposure time estimates
defined in the Phase 1 plan using the ETC and bootstrapped - with
uncertainties - from spectrally adjacent F727N (1% wide CH4) band
archival images from which cloud contrasts to local features were
anticipated to be significantly larger but by amounts not well
known. The goal for the test images is to plan the F763M transit
imaging to avoid image saturation for the brightest features that might
be seen while still proving sufficient total count statistics to a
photometric precision (not accuracy) of order ppm. Legal
(commandable) exposure times for WFC3 in the exposure time domain of
consideration are in the range of 0.5 to (perhaps) as high as 1.0s in
0.1s granular steps, but omitting 0.6s which is not a exposure time the
instrument supports. The Phase 1 planning suggested an exposure
time of 0.7s. The Visit 15 test images were taken with commanded
exposure times of 0.5s, 0.8, and 1.0s. It is clear from these
images that to avoid the risk of saturation against the brightest
F763M features that may appear during the GO 13067
experiment, all F763M exposure times in Visits 1 -14 inclusive
should be reduced from 0.7s to commandable 0.5s.
DATA
The three images acquired, for this purpose, were processed by the OPUS
calibration pipeline, and the "flt"* files (with pixel values reported
in electrons) were used to assess the final tuning of the Visit 1 - 14
F763M exposure times. Those data are non-proprietary and are now
retrievable from the MAST archive (http://archive.stsi.edu) along
with other calibration reference data files and OPUS products.
The specific files of interest are:
DATA FILE
NAME EXPTIME* UTC
ic3g15j2q_flt.fits 0.480000s 22:46:35
ic3g15j3q_flt.fits
0.800000s 22:49:37
ic3g15j4q_flt.fits
1.000000s 22:52:39
* OPUS reports a "calculated" exposure time of 0.480000s
for a commanded 0.5s exposure, and I confirm this proportionally from
count ratios in the ic3g15j2q and
unsaturated regions of the ic3g15j3q
the images.
SATURATION
AVOIDANCE
"On-orbit observations have shown that on UVIS2, the onset of
saturation
varies from about 67000 to 72000 electrons per pixel over the CCD,
while UVIS1 has a somewhat larger range of 63000 to 71000 electrons per
pixel (WFC3 ISR 2010-10)" per the WFC3 IHB for Cy20. The
referenced
ISR further informs the UVIS2 detector full well depth from 66850 to
72500 e- across the detector. Thus, to avoid saturation at any
point
in the image exposures must be planned to collect less than the
least-depth 66850 e- full well, with margin to allow for temporal
variation in the brightest cloud features. (N.B.: We are using the
UVIS2 detector).
DISCUSSION
A linear-display of the ic3g15j2q (0.48
s OPUS calculated exposure time) image, with a 0 - 60000 e- display
stretch, is shown in Figure 1 (top). To better visualize where on
the disk the brightest features are located (mid-disk,
equatorial region), the same data is reproduced with an
intensity-mapped "rainbow"color table (bottom). As John
suggested (and good for us),
the cloud contrast seen to small local features is indeed smaller in
this continuum filter than the adjacent CH4 band. Note (of
digression): The FLT files analyzed and shown have been corrected for
image
bias (from
detector overscan pixels and reference bias image), dark current, and
pixel-to-pixel flat field variations, but single-image CR-hit pixels
have not been corrected. These are the isolated white (top) or
black (bottom) pixels in Fig 1 and, in our full transit data analysis
will have to be considered, but are not considered here in tuning
exposure times for the surface brightness of the Jovian disk.
Figure 3 is a full disk histogram over the image shown in Fig 1
from 30000 - 60000 e-, with the very brightest regions on the disk
(excluding the few individual CR-hit pixels) on the disk are 52040 e-
(collected in 0.48 s). This provides a margin of x 1.28 against
features brighter than the brightest observed here w.r.t. the smallest
well-depth found anywhere on the UVIS2 detector (min full-well 66850
e-).
The next (longer) exposure time possible with WFC3/UVIS is 0.7s (which
we had tentatively planned). All other things being equal, this
would have "exposed to collect," at the peak brightness of the disk in
an equivalent image, 75892 e- , which is above over the
saturation threshold. Hence, we must reduce
our F763M commanded exposure times to 0.5 s.
The second of our test images was taken with 0.8 s exposure times, from
which significant saturation would be expected in the brightest regions
based on the unsaturated 0.48 s image. This is seen in Fig 3
where the linear display stretch has been set to an equivalent 0 -
100000 e- dynamic range (i.e., for 0.8s compared to 60000 e- upper
range used for the Fig 1 0 - 60000 e- display). Note in the
regions where the equatorial cloud bands are brightest (but well under
saturation in the 0.48s exposure) in this 0.8s exposure show image
vertical streaky vertical structure, which is a hallmark of charge
bleeding from saturated pixels, though virtually identical (modulo
small scale structural changes over appx 3 minutes in time) elsewhere
in the image.
For completeness, the 1.0s exposure is also shown (Fig 4), and clearly
is "way over the top".
SUMMARY
AND CONCLUSION
We must reduce our
F763M commanded exposure times to 0.5 s.
ADDENDUM:
A NOTE ON COUNTING STATISTICS
The 0.48s test exposure produced a count of 1.92E10 electrons
over the full disk.
On Sept 20 2012 (during the transit visits) the SURFACE BRIGHTNESS of
jupiter (modulo intrinsic changes in cloud structure and phase angle)
will be nearly identical because:
- the Sun_Jupiter distance changes only a very small amount
- the 1/r^2 change in the brightness of the return signal from
Jupiter_Earth is exactly compensated by the r^2 change in the angular
area of Jupiter with the Earth_Jupiter distance change
The disk of Jupiter, however, will appear 1.244x larger in angular
area, so all else being equal we should expect appx 2.39E10 electrons
per image over the full disk.
Because of SAA impacts during the transit we will obtain only 24 (of
max 30 otherwise possible) F763M images over the course of the transit,
so we will collect appx 5.8E11 e-. In terms of counting
statistics, though WFC3 has an A-to-D conversion gain of 1.55 e- per
ADU (Data Numbers off the A-to-D converter), so is "only" 3.7E11 counts
root(n) 6.1E5 or appx 1.6 ppm counting statistics. So our job has
gotten a little harder (thanks to the SAA), but was not unforeseen and
not show-stopper.


FIG 1. Top and Bottom, same data: 0.5 sec commanded Test Image 0
- 60000 e- linear display.
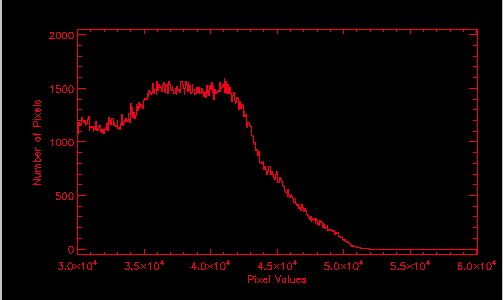
FIG 2. 0.5s commanded test image Full disk histogram

FIG 3. 0.8s exposure - saturating in mid-disk equatorial
clouds
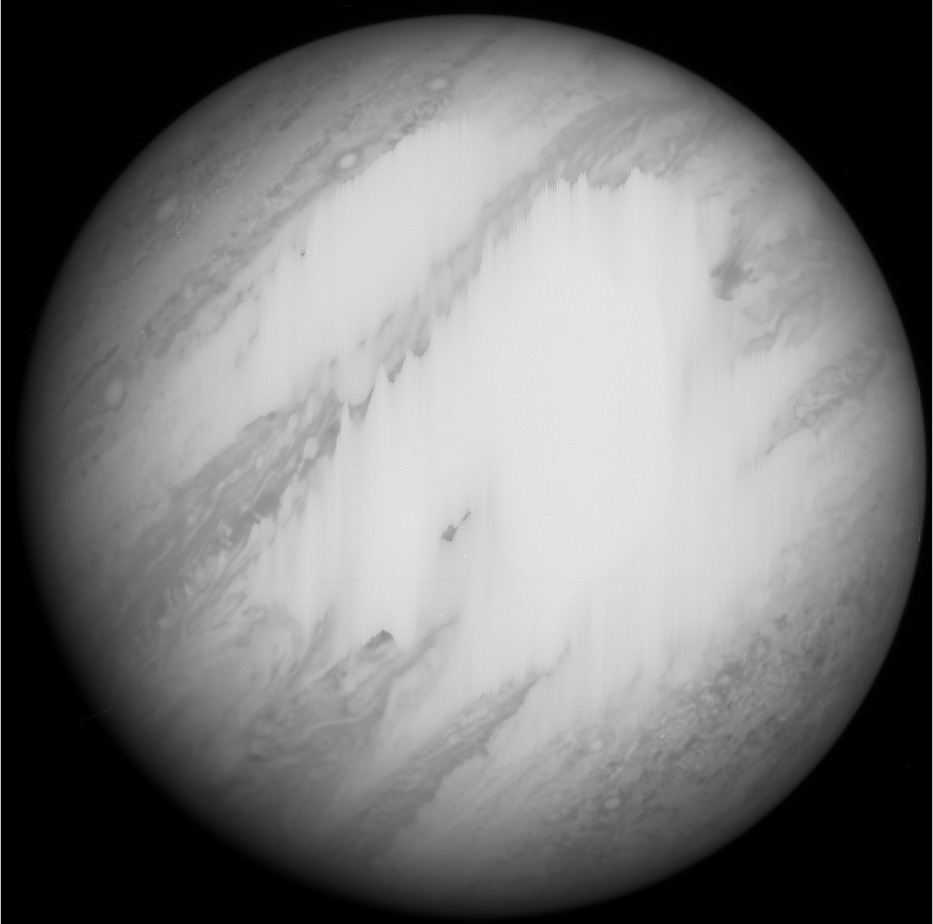
FIG 4. 1.0s exposure - speaks for itself...