SNP (LAKE
TURKANA) GROUND-WEATHER RISK ABBREVIATED SUMMARY
As previously written to in emails, based on a combination of in-situ historical weather reporting at Lodwar (as a proxy to nearby SNP) and remote sensing satellite data, the derived expectation value for seeing totality from SNP unobscured by intervening cloud is 65% +/-15% (i.e. a 35% risk of a "cloud out) from the ground. Here (immediately below to capture this information) is what I had previously summarized,. This is all "detail" that can be skipped if you read previously.
| It is obvious to us that {on the
ground} the immediate Lake Turkana
area is the stand-out best location for climatological expectation of
least cloud cover along the line-of-site to the Sun (despite its only
12 degree at totality altitude) -- excepting the extreme eastern end of
the path with the Sun VERY low, in the Ogaden region of Ethiopia and at
sunset in western Somalia that we reject for these and other
reasons.
The usual "metrics" that we use to try to assess the probabilities for
unobscured eclipse viewing, in this case, lead to different (though
still "best") expectations. Some of those differences ar
understood,
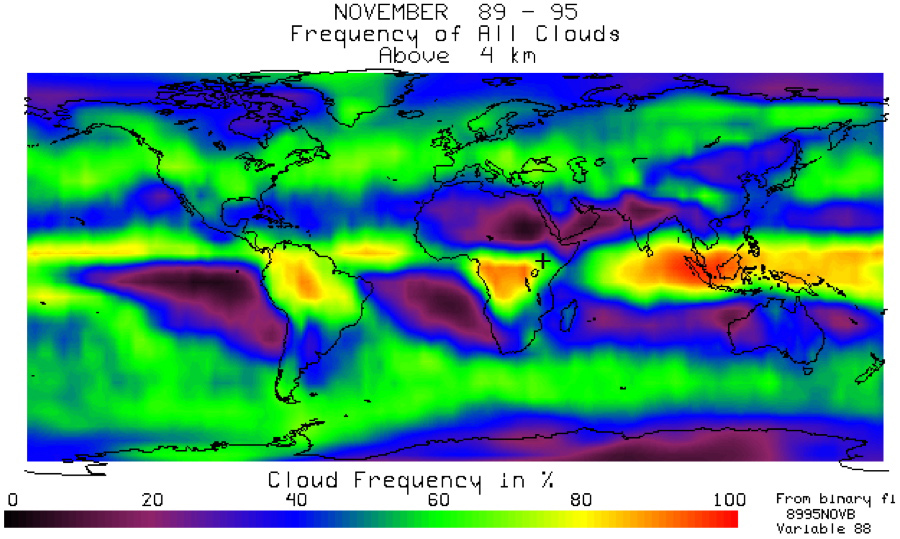
but that understanding does not help close the uncertainties. Let me summarize what we are currently working with, but also to point you to a weather summary meteorologist and eclipse-chaser Jay Anderson: http://home.cc.umanitoba.ca/~jander/tot2013/tse13intro.htm In particular, of course, is the information on the Lake Turkana and SNP region which is our focus. Let me call your attention first to "Table 1" entries for Lodwar that we use as a proxy for SNP as the weather in general we expect to be quite similar. These tabulated data are derived from in situ, on the ground, measures from Lodwar, so are in many respects "better" that what can be derived from remote sensing with satellites (those are the maps, in particular Fig 2, which is discordant in part for that reason). It is suggested that the column labeled "Percent of Possible Sunshine" is the best (single) indicator, with the highest correlation, to directly extract a probability of seeing the eclipse unobscured by cloud. What this metric actually is, by definition is: "The total time that sunshine reaches the surface of the earth, expressed as the percentage, of the maximum amount possible from sunrise to sunset with clear sky conditions." In table 1 this is based on early November data averaged over many years, where the number of maximum possible daylight hours is very close 12 hours. The data analyzed here suggest 80% (9.6 hours on average out of 12) with sunshine reaching the surface of the Earth. Other historical data archive sites consistently report 9 hours if 12 (to the nearest hour) of 75%. I am not concerned over that 5% difference, but is it actually that high? This seems somewhat counter (higher) than a different method of analysis that I will explain. Additionally these (and other data discussed below) are not discriminated by the time of day. What REALLY is of interest to us is the simple question: ow likely is it that we will se the eclipse (from the ground) unobscured by intervening opaque clouds - with the eclipse occurring an hour before sunset with the Sun 12 degrees above the western horizon looking out over Lake Turkana? And, what, actually, are the prevalent cloud conditions then? There is a different way to look at this, also reflected by this table as follows. Reported here are the (average for early November over many years) breakdown - by relative percentage - of different types of sky (cloud) conditions reported by in situ weather observers in Lodwar. This does not, unfortunately, give actual cloud type or height, but rather the sky condition w.r.t. obscuration as: Clear, Few, Scattered, Broken, Overcast, and Obscured. The distinction from individual observations (before averaging) is in how many eighths (or "octas") of the sky is covered by cloud of any type. These data can be used to compute a "Calculated Cloudiness", separately from the "Percentage of Possible Sunshine" which is a weighted average of the different percentages of the sky conditions. In some detail (more than probably needed here) the categories (not my doing, defined decades ago by NOAA and adopted globally) are as follows: Details: "Clear is no cloud. (It is suspicious to me that for Lodwar "Clear" is so low as only 1% in Table 1). "Few" is defined as “from zero to 2 eights – any amount up to 2/8ths except for zero itself. (This MAY be why "clear" is only 1%, since "few" also allow for 0 eigthts!). A perfect observer will observe 2 ½ eights as either 2 or 3 (doesn't matter which, as it’s the limit). Therefore, the range for the "Few" category is from zero to 2.5 eights cloud cover. The mid range is (2.5/8)*0.5 or 0.1563 (I transposed the 2 and 6 in the example I gave you). Similarly, scattered lies from 2.5 eights to 4.5 eights (formally, 3 and 4 eights). Broken lies from 4.5 eights to 8 eights. 8/8ths is overcast. Some of the categories are ranges, and some are fixed values." -- source email from Jay Anderson As a note "In reality, an observer is never that exact, and most will allow a small amount of cloud and still record clear, or have a few tiny openings and call it overcast." With the above quantification, one then computes the "Calculated Cloudiness" which is in other places sometimes called the "cloud amount" as a weighted average that is... cloud amount= 0.1526*few + 0.4375*scattered +0.7813*broken +overcast +obscured +partly obscured Many eclipse chasers rely on this number, BUT, it is actually not observationally well determined. It DOES provide a useful metric to intercompare different sites all measured in the same way, but not so good for an "absolute calibration". Jay Anderson (our meterologist friend who prepared the linked table) has said: {The Calculated Cloudiness} "is merely a number for comparative purposes. I could use the mid range of the formal definition, but the difference would be very small. The main error lies in the fact that cloud distributions are usually U-shaped {not at all randomly distributed}, and so linear estimates will have built-in biases". So, with the above caveat to be heeded, the "calculated cloudiness" for Lodwar is formally 51%, but may under- or over- estimate the actual expectation. The separately determined "Percent Possible Sunshine" of 75%-80% clearly paints a more optomistic picture. Neither may be fully accurate as an expectation value - and without knowing the biases a rational thing to do is simply to average these two at about 65% with then an uncertainty of about +/-15%. But again, despite this uncertainty -- which says we may have about a 2:3 chance of seeing totality on the ground, this does not inform at all if this the case an hour before sunset in particular. ONE MORE THING (mostly for my colleagues). If you look, particularly at Fig 2 on Jay's web page, the hi resolution "cloud cover" (yet still a DIFFERENTLY DERIVED metric) map this seems further discordant than with the in situ observations - far worse. Indeed this, derived from satellite remote sensing data over 24 years - and specifically using only AFTERNOON (more germane) data suggests for Lake Turkana about 65% cloud cover. THIS, however, is NOT the same as the expectation for seeing totality - as this is for ANY type of cloud, distributed in the sky in ANY manner Jay expressed this web page as (I add emphasis in bold): "The satellite-derived cloud cover charts are not exactly comparable to measurements taken from the ground {Table 1} by humans and machines. Observers and machines record from one spot, with an oblique view toward the surrounding horizons. Satellites observe from altitude, but also have oblique views toward the horizon, which lies much farther away than for a ground observer. Machines see only the cloud directly overhead and assemble areal measurements by keeping track of how the overhead sky changes with time. Detection of cloud from satellites relies on complex algorithms that compare infrared- and visible-light radiation measurements to make a judgment about the extent of cloudiness in the image pixels. Both ground-based and space-based observations are concerned with cloud amount, while the important parameter for eclipse-watchers is the opacity of the cloud - does it block the Sun? In the extreme, a sky that is covered by transparent cirrus cloud could be observed as overcast (in actual fact, it would be recorded as "thin overcast") though it provides little impediment to viewing an eclipse. The upshot is that satellite and surface-based observations are probably biased to report a heavier cloud cover than actually exists. The cloud charts in Figure 1 and 2 should then be used to compare sites with each other rather than to derive an exact probability of seeing the eclipse. That statistic is best represented by the percent of possible sunshine in Table 1." |
SNP (LAKE
TURKANA) REDUCING WEATHER RISK WITH UNPRESSURIZED AIRCRAFT
This est. ~ 35% +/- 15% risk of cloud out from SNP, Lake Turkana is reduced with a much less optimal ("last ditch") observation by air from the Caravan 208B aircraft at ~ 12.5 kft (~ 4km). This aircraft will not be able to get over cloud above that level. The expectation value for that somewhat uncertain but is likely to be ~ 60% for ALL types of cloud types (see below) including both optically thin/scattered, and opticaly thick/broken cloud.
The expectation for complete overcast skies is only 0.6% from the Lodwar records, but may be under-reported. However, from the historical precipiation record we might expect 2 days per month (6%) with thunderstorms (presumably inclusive of the separately reported overcast conditions) that would disallow the use of the aircraft backup scenario. I.e, there is about a 6% probability that if we geel the need to attempt observation by air (by expectation 35% probability) we would not be able to do so.
Otherwise, during the 29% of the time when there is cloud for which we might elect to take to the air and are able, we probably will have broken to scattered conditions. To assess the liklihood of such cloud in the line-of-site to the Sun at heights above the aircraft we use as a proxy for the average opacity of the different mix of cloud typesas linear combination weigted mean of total cloud amount of 51%. This leads to an expectation of frequency*cloud_amount = 30%. I.e. 70% of the time that we would take to the air (29% expectation) we likely could find a clear site-line to the Sun.
Summary:
Expectation of seeing the eclipse from the ground: 65% +/- 15%
Expectation of cloud-out with inability to fly: 6%
Expectation of "need" to fly: 29%
Expectation of seeing totality fron the air 12.5kft (in clear skies or optically thin clouds) = 70%