PRELIMINARY CCD IMAGING RESULTS
UPDATE 9 DEC 2003 - CALIBRATED IMAGES (from
which the mosaiced composite on the top of this page was made) NOW AVAILABLE:
CLICK
HERE.
SBIG ST-2000XM CCD
Camera, graciously on loan from the Santa
Barbara Instrument Corporation. The imaging program for the CCD camera
was devised by J. Pasachoff and S. Sousa (Williams College) and was autonomously
executed under computer control during the flight. This program acquired
green-filtered coronal images, executing a repetitive sequence of 10, 20,
and 40 millisecond exposures with an inter-exposure cadence of 4 seconds
throughout the total phase of the eclipse.
Below are some of the very first preliminary results from
the imaging program. Check back again, as this will be updated and
expanded over time.
SBIG ST-2000XM 1600x1200 CCD CAMERA (Green Filter)
CAVEAT EMPTOR: UNCALIBRATED
Five 0.04s EXPOSURE REGISTERED MOSAIC
30% Radial Median Intensity Profile Subtracted
Log10 Display, [3.9] dex (7950:1 Linear) Dynamic Range
(The artifacts will go away after calibration)
Notes on above Image:
1) The above image is a mosaic made from five (5) of the 40ms exposures
taken as part of the CCD imaging program,
2) The camera platform pointing changed between images, thus providing
a wider effective field-of-view. The original raw images are shown
in thumbnail form below:
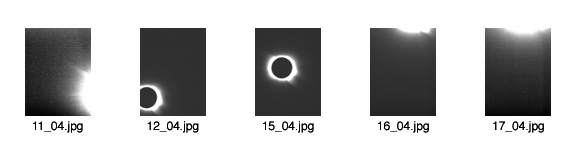
The image shown above was made from frames 11 - 17 of the 40ms imaging
sequence. Frames 13 and 14 are excluded as the Sun was not in the
field of view of the CCD camera when those frames were taken. Sequential
frames are four seconds apart, hence frame 17 was taken 24 seconds after
frame 11.
3) The projection of the rotationally and translationally co-registered
fields onto the sky is illustrated in two figures below. The images
are critically sub-pixel co-aligned on the features in the corona, not
on the lunar disk. The apparent position of the moon moved significantly
w.r.t. the Sun between exposures.
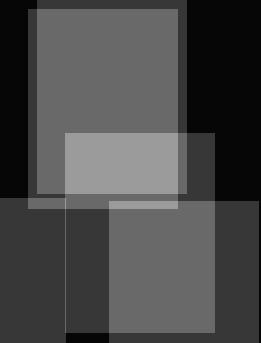
The figure on the left is a simple co-addition of the offset pointed
raw images after co-registration. As is apparent there is some amount
of field overlap in portions of the wider mosaiced field. The figure
on the right illustrates the number of frames which contribute to a later
done median collapse of the five images. Black = 0, Dark Gray
= 1, Middle Gray = 2, Light Gray = 3.
4) Prior to combining the registered frames a calibration dark/bias
frame was subtracted from each. This calibration reference file was
made from a median combination of 25 dark/bias frames taken on the aircraft
immediately prior to the start of the eclipse imaging sequence.
5) NOTE: At this point the individual frames have *NOT* been flat-fielded,
so the intra-frame photometric calibration is not correct, and they cannot
acdtually be properly combined without introducing artifacts in the combination.
A flat-field reference file will very soon be provided by Steve Sousa and
a proper image combination, devoid of the artifacts apparent in the topmost
image can then be done.
6) Ahead of obtaining and applying a reference flat, the registered
images were nonetheless median collapsed (though that will have to be done
over again after flat fielding). Because the CCD has a very large
non-saturating dynamic range the information recorded cannot be shown in
a single linear image. Below, the inner regions of the corona captured
in this image are shown:
CLICK ME!
To step through a linear display series, increasing the display gain
by factors of 2 in each step, click on the above image. (This is a QuickTime
movie; if your browser does not display it in-line then download and use
a stand-alone QuickTime viewer).
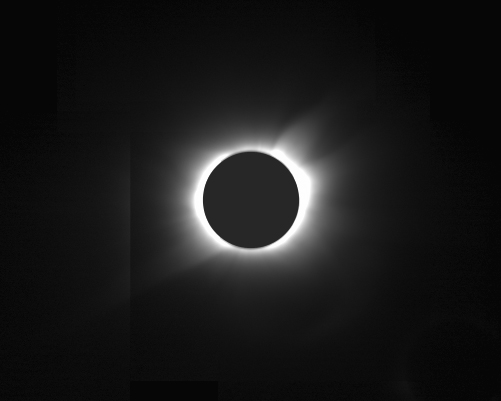
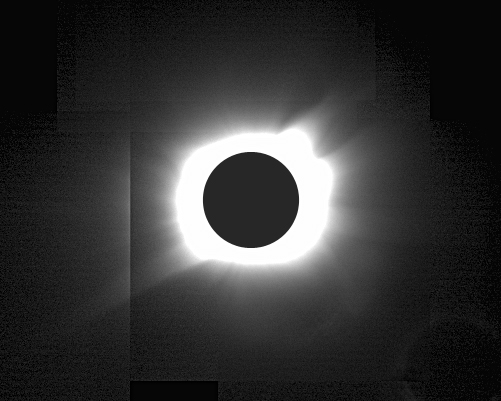
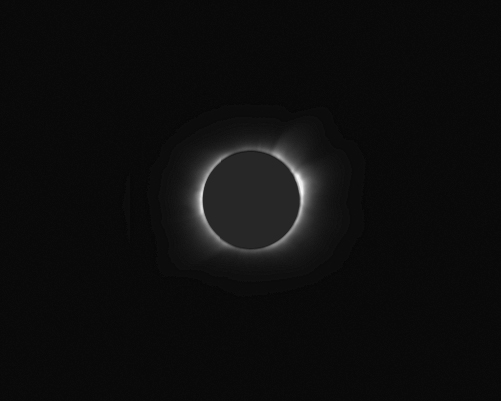
7) More of the corona can be seen in a single image in a square root
display. Below are two flavors: Above inner and mid corona, and below
mid and outer corona.
Again, the "seaming" artifacts will go away after flat-fielding.
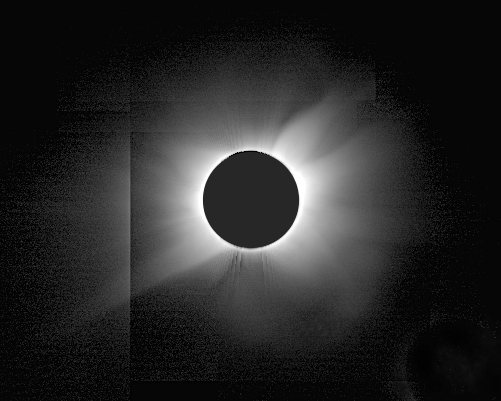
7) More of the corona l structure can be seen in a single image in collapsing
the dynamic display range by taking the Logarithm (base 10 in this case)
of the image. Note, for example, the coronal streamer at the lower right
which can be traced from the occulted solar limb (0.5 Rsun) out to 5 solar
radii.
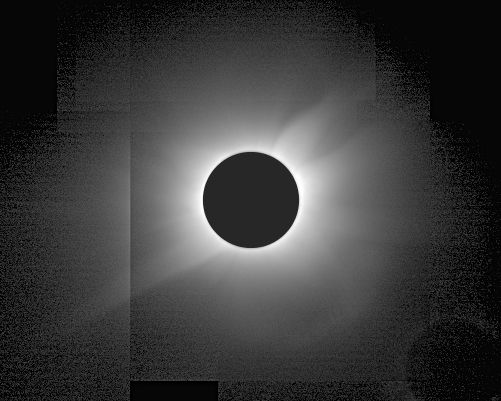
8) For better show the azimutally differentiated coronal features (streamers
and holes) the underlying radial brightness gradient is partially subtracted.
This was done by measuring the radial brightness profile, on the azimuthal
median, in all zonal regions one pixel wide, then subtracting 30% of the
intensity of that radial profile at every corresponding radial zone.
30% is subjective, but the criteria is to not oversubtract any local feature
to a negative value, which could then not be represented in a log display.
This "final" result is what was shown at the top of this page, and repeated
here for contextual continuity:
The vertical striated "features" introduced in the corona on either
side of the vertical axis of symmetry is due to display aliasing of the
quantized subtracted radial profile. This can be easily eliminated
by simple 2 (or 3) point boxcar smoothing of the radial profile.
I certainly will do this after repeating this process with the data after
it is flat-fielded.
Lastly, for now, on the CCD images, the same can be done for the 10ms
and 20ms CCD images. And then, when all are photometrically calibrated,
all cam be combined onto a single final image to improve both the radial
display range and the signal to noise.
As a FINAL note here, the actual data images are larger in linear scale
by 4x, i.e., have 16x more pixels than shown above. A smaller format
was used just for web viewing.
More will be coming!!!!
http://nicmosis.as.arizona.edu:8000